Ministry of Blue Economy and Fisheries, Zanzibar · GovTech / Blue Economy · Feb–Jun 2026
One map for 20+ development partners and 40+ NGOs: Zanzibar's blue economy MIS
Delivered as a sub-contracted partner · 4-week build
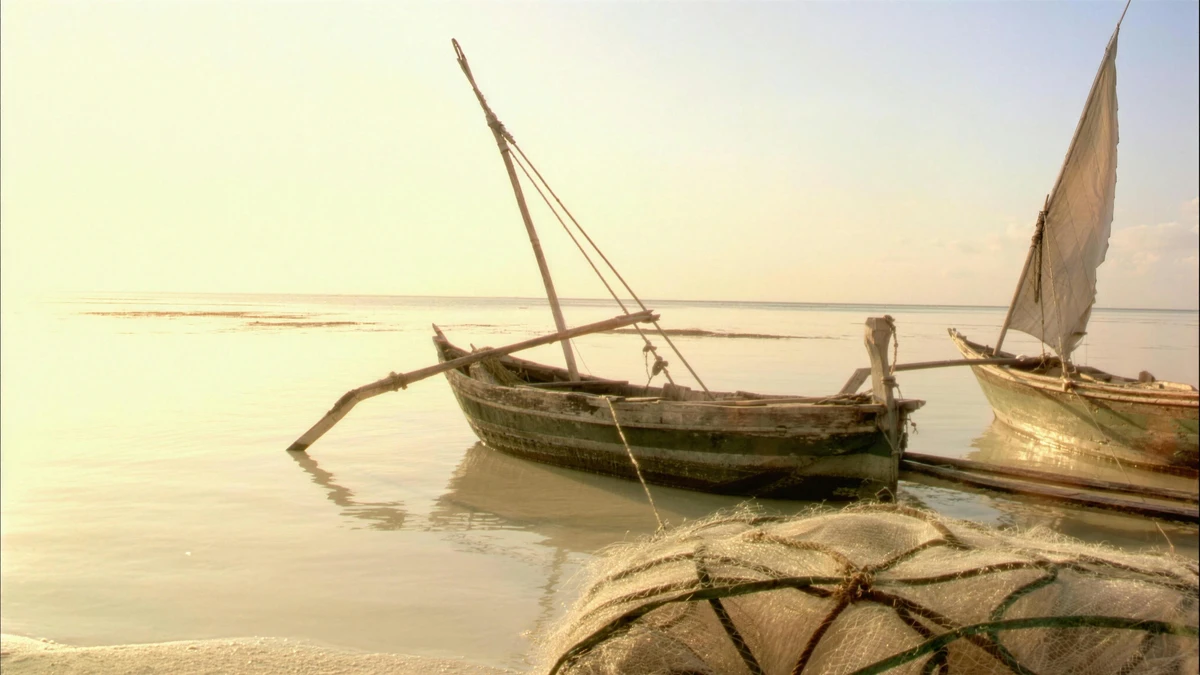
Zanzibar’s blue economy (fisheries, seaweed, marine conservation, coastal livelihoods) is implemented by more than 20 development partners and 40 NGOs at once. Under IFAD’s Agriculture and Fisheries Development Programme (AFDP, a USD 58.85M programme), the Ministry of Blue Economy and Fisheries commissioned a management information system to bring all of that activity into one place. I designed and built the entire system end-to-end in a four-week sub-contracted engagement. It is live at mis.blueeconomysmz.go.tz.
The challenge
The ministry had no consolidated view of who was doing what, where. Coordination across 20+ development partners and 40+ NGOs ran on fragmented Excel spreadsheets and email chains. That produced three concrete problems.
First, NGOs faced duplicative reporting burdens: the same project data requested repeatedly in different formats by different offices. Second, geographic coordination gaps were invisible: nobody could see that one district had five overlapping livelihood projects while a neighbouring one had none. Third, evidence-based policy decisions were effectively impossible, because the evidence lived in dozens of disconnected files.
The pain was sharpest during IFAD supervision missions. Assembling a data package for a mission took roughly three days of manual Excel compilation and reformatting, every time.
There was also nothing to buy. To our knowledge, no purpose-built blue economy coordination platform existed anywhere; multi-stakeholder policy coordination with spatial project tracking is not a category commercial software covers. This had to be built.
The approach
Three design decisions carried the project.
Map-native architecture. I built on PostgreSQL 16 with PostGIS as the spatial foundation and made the map the primary interface, not a feature bolted onto a table view. Projects render on an interactive Leaflet map with district and conservation-area overlays, so geographic gaps are visible by default: you see the empty district before anyone has to run a query.
Adoption as architecture. Government systems die when the first user opens an empty database and a 40-field form. I encoded the adoption mechanics into the technical design instead of leaving them to training: the system launched pre-populated with 15+ real projects, every data-collection form is limited to fewer than 15 fields, and the payoff is immediate. Submit your project and it appears on the map alongside everyone else’s.
Sovereign by design. The stack is entirely open source: Next.js 15 App Router on Node 24, PostgreSQL with Drizzle ORM, Auth.js v5, shadcn/ui, and Recharts, deployed with Docker Compose on Tanzanian infrastructure. No vendor lock-in, no licence fees, and the system is scoped so the ministry’s own IT officer can operate it without ongoing international developer support.
On top of that base I built four-tier role-based access control, standardized forms for partners, projects, and institutions, and automated IFAD-compatible exports, with a design target of cutting the three-day report scramble to under one hour.
The four-week build sat inside a February-to-June 2026 delivery arc: site inspection on 13 March, client presentation on 27 April, and training delivered to four distinct user segments on 28 April.
The outcome
The system is live and in real use. The public-facing dashboard gives every stakeholder a transparent view of blue economy activity across Zanzibar, from the ministry and its development partners to NGOs and citizens, while role-based access separates what ministry staff, development partners, and NGO users can see and edit. The interactive map covers all Zanzibar districts and conservation areas, so programming gaps that used to be invisible are now the first thing you notice.
The reporting target held: at acceptance, generating an IFAD-compatible data package took under one hour, against the roughly three days of manual Excel work it replaced.
The result I weight most heavily is quieter than any launch metric: between go-live and 23 June, the system went through three post-launch change cycles, every one driven by ministry staff actually working in it. Change requests from real daily use are the difference between software that was delivered and software that was adopted. A wishlist gets written before launch; friction reports only come from people who depend on the thing.
To our knowledge, this is the first purpose-built blue economy coordination platform anywhere, and it runs on open-source software, on Tanzanian servers, under the ministry’s full control.